


 7:43 AM
 Brian Seltzer
 How to perform quick Windows performance analysis on your Windows server. Your users are complaining about poor performance. When you receive this kind of complaint, the first thing you do isn't to setup a performance monitor log and start collecting statistics over several days. Well, maybe you do, but I don't. I look at a few items, and if there's a resource constraint, it should be apparent in about 60 seconds. In that amount of time, you should be able to report whether there is a problem with the server or not, and what if anything will fix the problem.
Resources
There are four basic resources that affect the performance of a server. They are the speed and availability of CPU, Memory, Network, and Disk. Of course there are other things to consider when you're planning to build a new high-performance server (front-side bus speed, slot architecture, IO cards, etc), but when evaluating the performance of an existing server, we can look at the basic four to see whether the server is performing as it should. If any of the four are "maxed out", performance may suffer, and you should be able to quickly spot the problem.
If you are looking at a server that is less than five years old, the odds are that it has at least two dual core processors running at 2 - 3 GHz (more cores if the server is even newer) and it probably has two gigabit network ports built in. That's a lot of CPU power and network bandwidth for most servers.
That leaves memory and disk as the most likely resources that hurt performance. If your server is short on memory, it may use "virtual" memory, meaning that it will try to temporarily move (swap) data from memory to disk to free up memory to keep working. Since disks are so much slower than memory, swapping will slow a server down dramatically. Memory is pretty cheap these days, and it's not that expensive to install as much memory as the server will ever be able to use. So, quite often, we've got plenty of fast CPU, memory, and network bandwidth available to the server. What's left to slow us down? The disk.
I support more than 12,000 servers, and let me tell you, when I'm looking at performance problems, 90% of the time, it's the disks.
Checking Things Out
So you've received a complaint about a slow server. For a quick check, remote desktop to the server. Once logged on, there are two built-in tools available to see what's going on: Task Manager, and Performance Monitor. Right-click the task bar and click Task Manager.
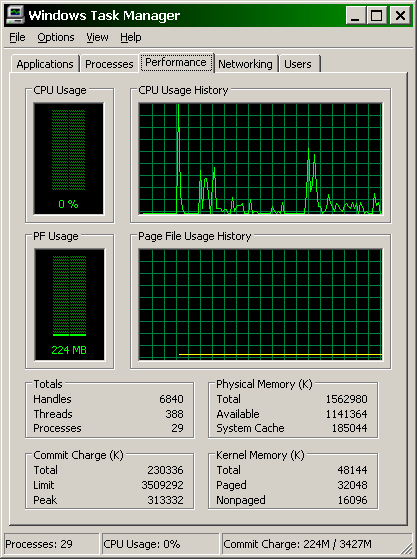 |
| Figure 1 - Performance Tab |
Looking at CPU Usage
Click on the Performance tab, and right away you can see how much CPU and memory is being used (see figure 1). As you can see, the graph in the upper right is the CPU Usage History. Looking at the figure, it's pretty obvious that the CPU on this server is not very busy. If we saw the CPU riding near 100%, then we'd know that we've got something using up a lot of CPU, and that might be why the server is slow.
 |
| Figure 2 - Process Tab |
Looking at the Network
A Quick look at the Networking tab will show you the current utilization of the NICs in your server. If you have more than one NIC, select each one in the list and watch the graph. Remember that Ethernet rarely can run at 100%. Performance starts to degrade when utilization is around 60%, so if your NIC is running that much, performance may be impacted.
Looking at Memory
Refer back to figure 1, in the lower right corner is the Physical Memory information. Memory not currently in use by processes will be divided into Available Memory and System Cache. The OS will adjust the ratio as best it can to keep things running, until processes are using just about all of the memory. If both the available memory and cache memory are very low, the server is bound to be swapping to disk and performing poorly. According to task manager, this server has enough memory and we need to look elsewhere for our trouble.
In figure two, you can click on the Mem Usage column header to sort the processes by memory usage, giving you a good view into what processes are eating up your memory.
Adding memory is probably the easiest and cheapest way to improve performance, if your server indeed does not have enough of it. However, before you cram 24GB of RAM into your file server, you should know about the memory limits of the OS version you are running, specifically, 32 bit (x86) versions of Windows.
First of all, 32 bit Windows means that there are 32 bits through which to address memory. What that means is that the amount of memory that can be accessed is 2^32 or 4294967296 bytes (4GB). This is the maximum amount of memory that 32 bit Windows Server Standard Edition can see. Windows keeps half of this memory for itself, leaving a maximum of 2GB of memory available to other processes. And usually, a process can't quite use even that much, and typically maxes out at around 1.7GB.
It's common to see SQL servers, domain controllers, Weblogic Java processes using around 1.7GB. That's as much as they'll ever be able to use, and adding more RAM to the server won't provide more RAM for them to use. If your big processes are using 1.7GB or RAM, and the rest of the processes on your server have the RAM they need, and you've still got some available memory, then you've got enough memory and there's no sense in adding more.
32 bit Windows Enterprise Edition can see more than 4GB and can make use of it using a technique called PAE (physical address extensions) which involves swapping data between memory below 4GB and above 4GB as processes need it, however, a single process is still limited to 2GB RAM max. The only way to effectively use the extra memory is if you have multiple processes using up to 2GB of RAM each, that are PAE compatible.
64 bit Windows shreds the 4GB limit by supporting up to 16TB of memory.
Kernel Memory
Looking again at Figure 1, in the very lower right, is the Kernel Memory information. The amount of memory allocated to the paged pool and the non-paged pool is listed here. These are areas of memory allocated by the system to service various system-level tasks, such as memory space for incoming TCP/IP connections, registry data held in memory, desktop heap for interactive users (terminal server users for example), and things like that. Again, 32 bit Windows has limits on how much memory it can use for these items. The maximum paged pool size is 470MB and the non-paged pool is limited to 256MB. Once the pools grow to these sizes, no amount of additional memory will make them any bigger.
64 bit Windows paged and non-paged pools can grow to 128GB each.
Pool memory is usually sufficient, but can run short in certain situations. For example, a file server or a web server with an extremely high number of very active connections can run short of pool memory, because the system allocates some pool memory for each TCP/IP connection. Terminal servers can also run short of pool memory when many users are logged on at the same time (each with their own desktop heap).
Anyway, the point is, if you see the Kernel memory usage running high, you may experience slowness in connecting to the server over the network (waiting for the server to find the memory to allocate to your connection). At this point you'll probably start to see warnings in the Eventlog that pool resources are exhausted. There's some tweaking you can do, but again that's a topic for another discussion.
Finally, on to the disk, the most common bottleneck these days and the least often looked at.
Disk IO
The disks are the ultimate bottleneck in your server. Everything else is fast solid state electronics, with operations measured in nanoseconds. The disks are slow mechanical devices, with operations measured in microseconds at best. Have you ever been staring at an hour glass waiting for your computer, and glanced down at your hard disk light, blinking like mad, practically on solid? Your computer is waiting for the disk to catch up.
Unfortunately, task manager does not have a disk view. This is where we pull out Performance Monitor (perfmon). Perfmon can be run from the administrative tools, or you can type perfmon in the Start - Run box. Once perfmon is loaded, we'll want to look at two important performance counters to get a view of how busy the disk(s) are.
 |
| Figure 3 - Busy Disk |
Now you can see the disk activity in real time. The % Idle Time graph will be at 100% if no disk activity is occurring or will be at 0% if the disks are working as fast as they can. It's OK if the Idle Time is at 0%, as long as the Current Disk Queue Length remains low. The Current Disk Queue Length is the true measure of performance degradation. In Figure 3, you can see that this server is running at or close to 0% Idle Time (white line) and the queue length (pink line) is climbing. It's not yet so bad that the server is constantly buried, but performance is probably poor for intermittent periods.
When the Idle Time is at 0%, and requests for data are coming in faster than the disk can handle, requests start to queue up, and you'll see the queue length climb. As it climbs, users are waiting for their files to open. If the queue length is regularly higher than single digits, your server performance is degrading due to a disk IO bottleneck. This is quite common.
Summary
We can now quickly view the four main resources that dictate server performance, and determine which one, if any, are slowing us down. What to do when you find a resource bottleneck is the next question, that we discuss in the next article, Windows Performance Improvement.
 Image icons used on this site are courtesy of Oxygen-icons.org
0 comments:
Post a Comment